Featured
-

Arlington, VA
Reporting on the Rise of AI: A RAND-Poynter Masterclass
June 28, 2024– June 28, 2024Benjamin Boudreaux
$0.00 -

Online, St. Petersburg, Fla.
Editorial Integrity and Leadership Initiative (2024-25)
September 16, 2024– April 13, 2025Sitara Nieves
Tony Elkins
$0.00 -

Online
Beat Academy (2024)
February 1, 2024– September 26, 2024Jon Greenberg
Caryn Baird
Dana Afana
Theresa Cardinal Brown
Kimberly Adams
Grace Abels
$75.00 per person -

Online
Work-Life Chemistry (2024)
Start AnytimeKristen Hare
$50.00
Broadcast & Visual Journalism
-

Online, St. Petersburg, Fla.
Poynter Producer Project (2024)
June 4, 2024– September 10, 2024Kerwin Speight
$799.00 -
Sale!
Online
Midterm Essentials: Election Issues Local Broadcast Journalists Should Know
Start AnytimeAl Tompkins
Cardiff Garcia
$0.00 -
Sale!
Online
From the Frontlines: A Photojournalist’s View from Insurrection to Inauguration
Start AnytimeJoie Chen (she/her)
$0.00 -
Sale!

Online
Make Design More Inclusive: Defeat Unconscious Bias in Visuals
Start AnytimeTan Ly
$0.00
Business & Work
-
Online
Work-Life Chemistry (2024)
Start AnytimeKristen Hare
$50.00 -

Online, St. Petersburg, Fla.
Table Stakes: Poynter’s Local News Innovation Program (2023)
January 17, 2023– December 8, 2023Quentin Hope
Glenn Burkins
$500.00 -
Sale!

Online
Content Audits and Centering Audience (December 2021)
Start AnytimeKathy Lu
$0.00 -
Sale!

Online
Diverse Voices and the Future Newsroom
Start AnytimeJoie Chen (she/her)
$0.00
Ethics
-
Online, St. Petersburg, Fla.
Editorial Integrity and Leadership Initiative (2024-25)
September 16, 2024– April 13, 2025Sitara Nieves
Tony Elkins
$0.00 -

Online
Transforming Local Crime Reporting Into Public Safety Journalism (2024)
March 19, 2024– August 20, 2024Kelly McBride
Chris Sheridan
$1,000.00 -
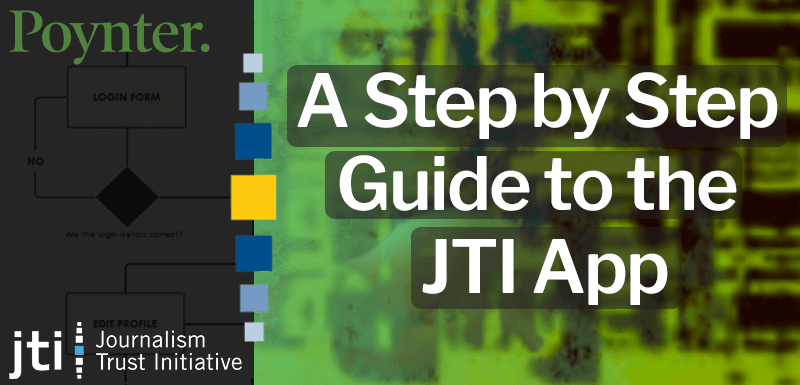
A Step By Step Guide to the JTI App
Start AnytimeAlanna Dvorak
$0.00 -

Online
Ethics for Editors: How to Manage and Advise on Ethical Issues
Start AnytimeAnita Kumar
$50.00
Fact-Checking & Media Literacy
-

Online
Getting It Right: Accuracy and Verification in the Digital Age
Start AnytimeVanya Tsvetkova
$50.00 -

Online
Luchando contra la desinformación en español: elecciones de medio término y comunidades latinas
September 20, 2022– September 22, 2022Tamoa Calzadilla
$0.00 -
Sale!
Online
Midterm Essentials: Election Issues Local Broadcast Journalists Should Know
Start AnytimeAl Tompkins
Cardiff Garcia
$0.00 -
Sale!

Online
How Any Journalist Can Earn Trust (International Edition)
Start AnytimeJoy Mayer
$0.00
For Educators

Leadership
-
Online, St. Petersburg, Fla.
Editorial Integrity and Leadership Initiative (2024-25)
September 16, 2024– April 13, 2025Sitara Nieves
Tony Elkins
$0.00 -
Online, St. Petersburg, Fla.
Media Transformation Challenge: A Poynter Institute Executive Fellowship (2025)
January 13, 2025– January 12, 2026Charlie Baum
Amanda Barrett
Karen Gordon
Doug Smith
Benjamin Wagner
$29,750.00 -

St. Petersburg, Fla.
Essential Skills for Rising Newsroom Leaders (May 2024)
May 6, 2024– May 10, 2024Tony Elkins
$1,500.00 -

St. Petersburg, Fla.
Essential Skills for Rising Newsroom Leaders (December 2024)
December 2, 2024– December 6, 2024Tony Elkins
$1,500.00
Reporting & Editing
-
Arlington, VA
Reporting on the Rise of AI: A RAND-Poynter Masterclass
June 28, 2024– June 28, 2024Benjamin Boudreaux
$0.00 -
Online, St. Petersburg, Fla.
Editorial Integrity and Leadership Initiative (2024-25)
September 16, 2024– April 13, 2025Sitara Nieves
Tony Elkins
$0.00 -
Online, St. Petersburg, Fla.
Poynter Producer Project (2024)
June 4, 2024– September 10, 2024Kerwin Speight
$799.00 -
Online
Beat Academy (2024)
February 1, 2024– September 26, 2024Jon Greenberg
Caryn Baird
Dana Afana
Theresa Cardinal Brown
Kimberly Adams
Grace Abels
$75.00 per person
Writing
-

Online
Editing Tools: How to Use Roy Peter Clark’s ‘Writing Tools’ as an Editor
Start AnytimeRoy Peter Clark
$50.00 -

Online
Working with Writers: How Editors Can Improve Words, Author Relationships and the World
Start AnytimeSteve Padilla
$50.00 -

Online
Language Primer
Start AnytimeMary Bishop-Baldwin
Roy Peter Clark
Mark Allen
$50.00 -

St. Petersburg, Fla.
Power of Diverse Voices: Writing Workshop for Journalists of Color (November 2023)
November 15, 2023– November 18, 2023Tom Huang
$0.00